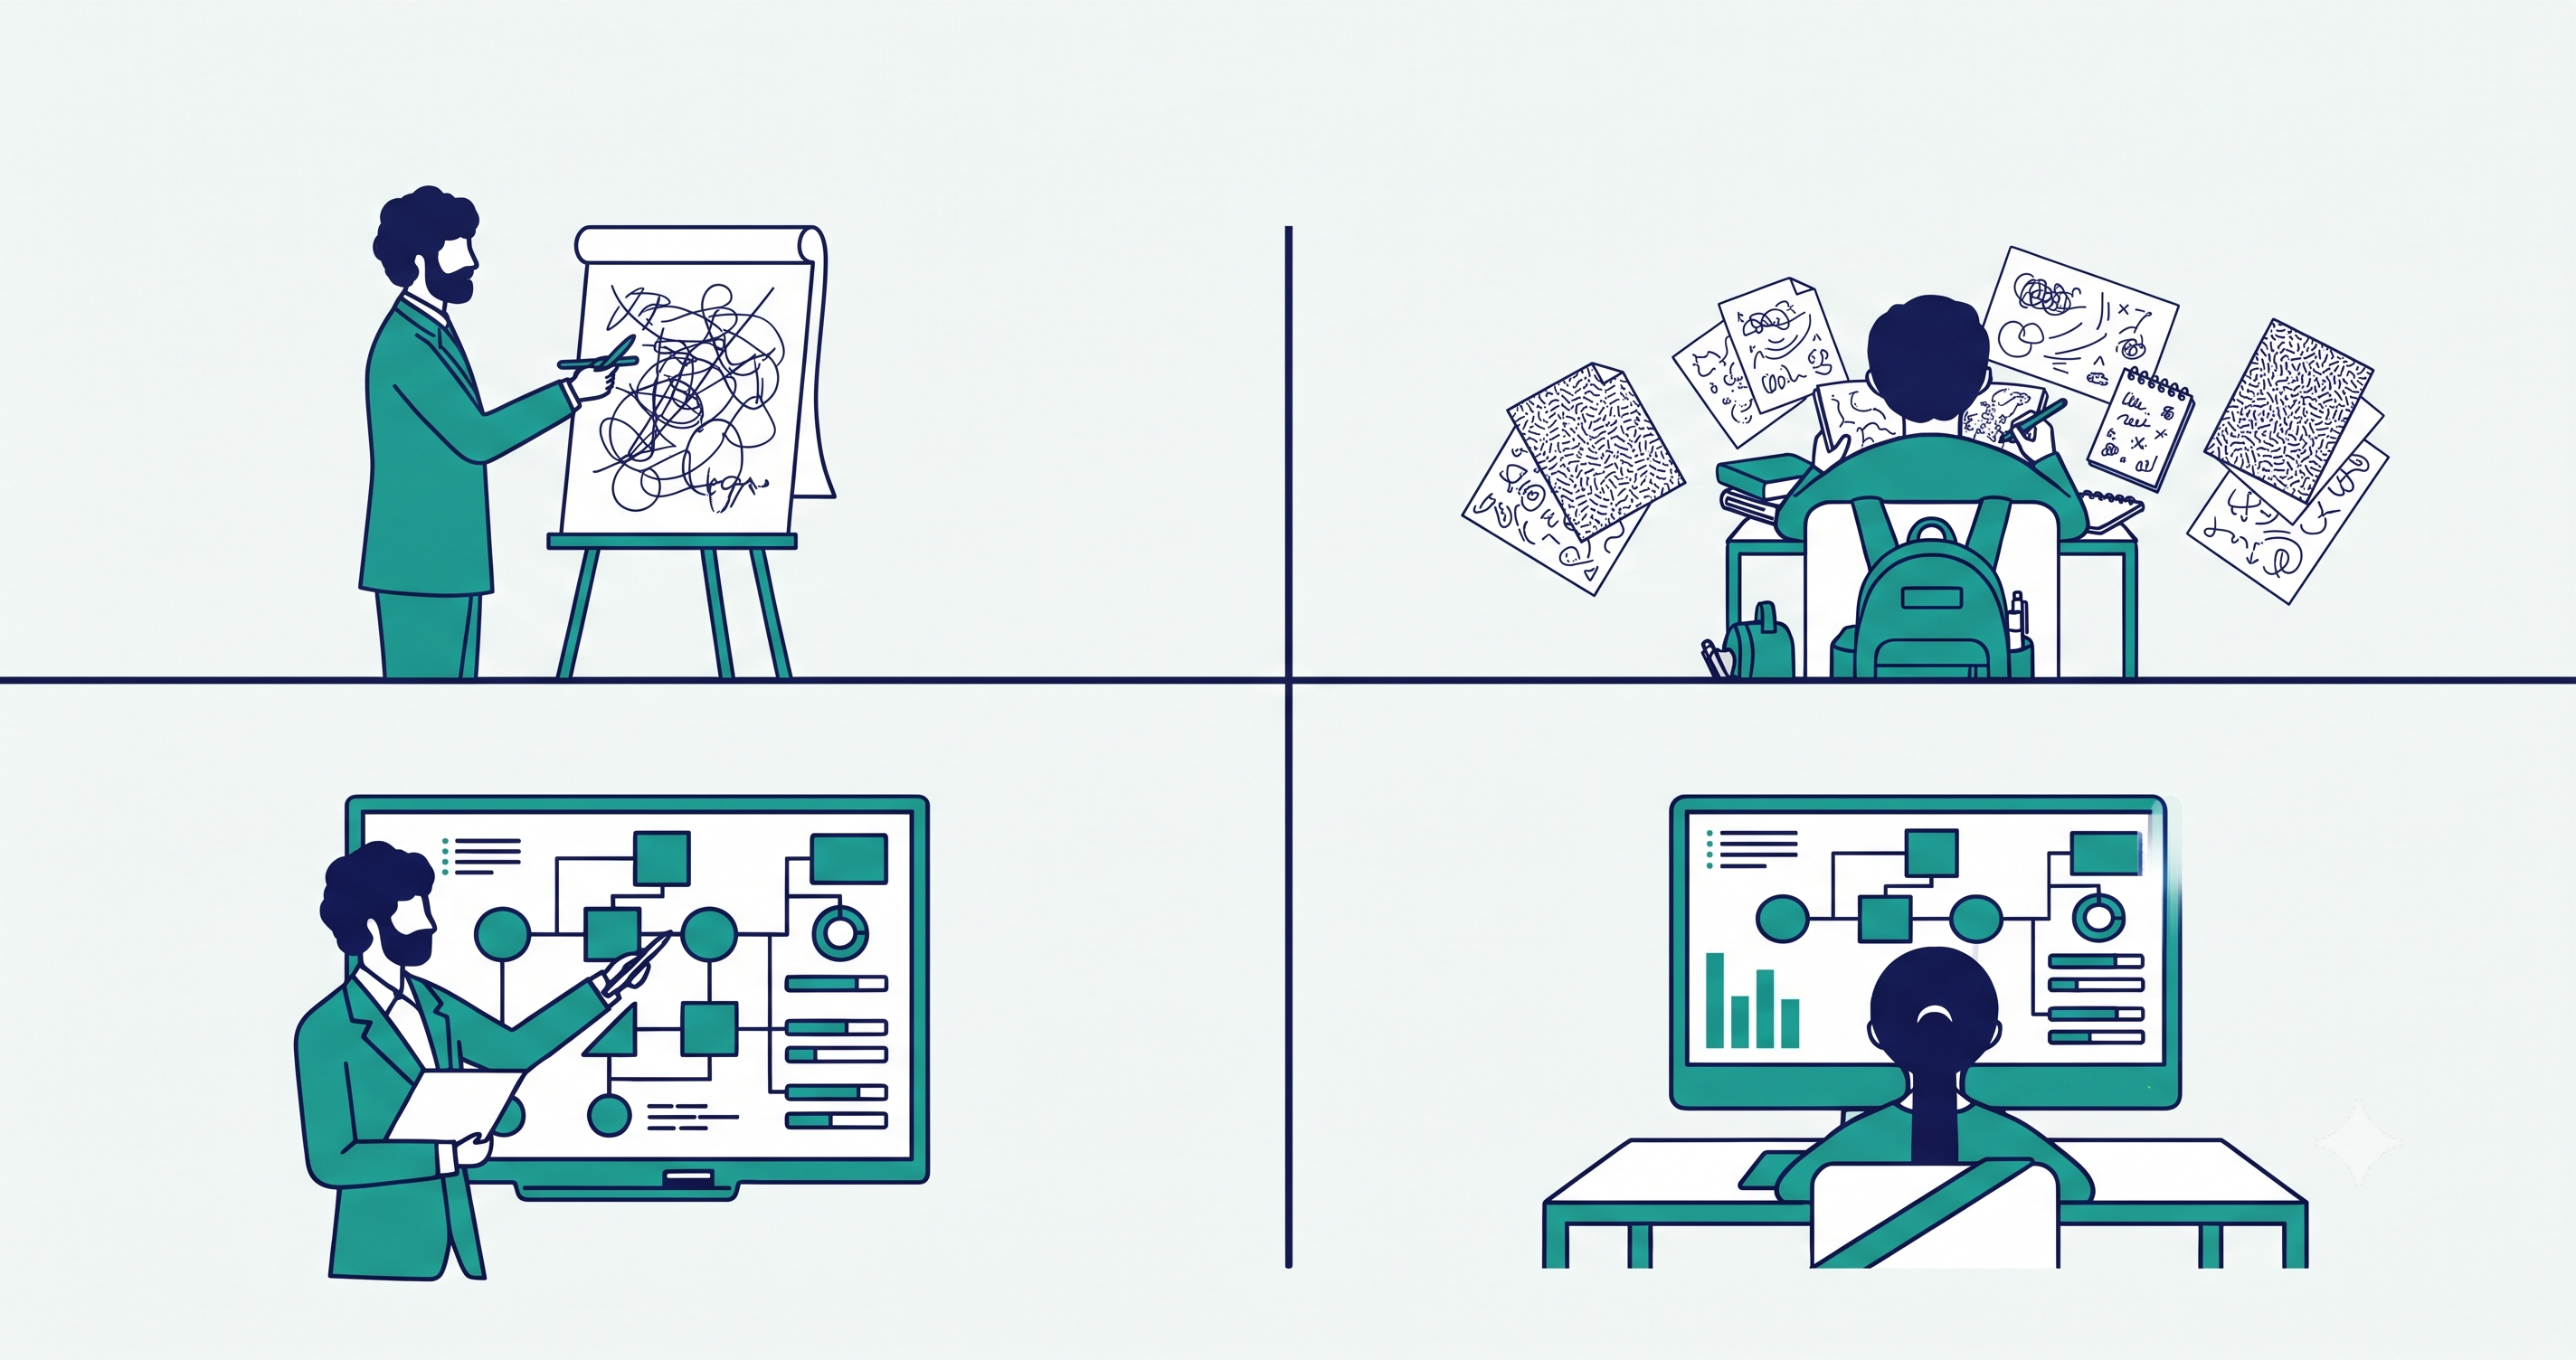
Why business education must ditch static diagrams for live data modeling
Large-scale public research universities and business colleges face an expanding gap between traditional, theoretical curricula and the fast-paced, highly automated realities of the global corporate sector. When professional training programs fail to modernize their technology footprints, critical liabilities emerge:
-
PowerPoint doodle trap: Without rigorous, standardized platforms, students default to basic presentation slides or hand-drawn sketches to map out business processes. These static files look okay on a slide deck but lack the underlying structural integrity, correct notation, and logic constraints required for real-world business engineering.
-
Administrative waste: Relying on legacy, desktop-installed diagramming software or restrictive "free tiers" forces IT departments to manage a fragmented mess of software. This jacks up procurement overhead and takes away class-to-class continuity.
-
Cheating blind spot: When assignments are submitted as static PDFs or image exports, professors lose the ability to see how the work was built. It is impossible to verify authentic student contribution or catch file-sharing, creating a massive quality-control blind spot.
The classroom needs an operational twin
To build actual technical capability and stop managing disjointed software tiers, business faculties must embed a cloud-native visual ecosystem directly into their core curriculum. This functions as a pedagogical operational twin—shifting students from passive, conceptual discussions to live systems architecture.
1. Standardizing system architecture and data flows
By moving the entire information systems curriculum onto a unified enterprise platform, professors can enforce real industry standards. Students learn to translate chaotic, text-based business cases into functional flowcharts, transaction cycle process maps, and data flow diagrams (DFDs) using the exact visual lexicon the industry demands.
2. Transitioning to automated database engineering
In advanced coursework, a modern visual platform evolves from a simple drawing canvas into an active code-generation repository. Instead of treating database design as a theoretical text exercise, students execute live data modeling.
3. Catching plagiarism via active revision trails
Requiring students to submit assignments via live, interactive workspace links completely protects academic integrity. Faculty can actively audit the full document revision history. Instructors can see the entire construction lifecycle step-by-step, ensuring the student actually did the work and eliminating the cheating risks associated with static file uploads.
Curriculum modernization roadmap
Moving a business department from legacy desktop tools to an integrated enterprise visual platform requires an execution strategy aligned with central university systems:
Phase 1: Modernize the tech stack
-
Tactical action: Phase out outdated, desktop-only diagramming programs and consolidate unmanaged free-tier software into a single campus agreement.
-
Institutional outcome: Eliminates local software support headaches and establishes uniform, equal access for all students.
Phase 2: Drive automated code engineering
-
Tactical action: Deploy data-vetted Entity-Relationship Diagram (ERD) templates capable of direct SQL dialect export.
-
Institutional outcome: Equips graduates with the practical database creation skills highly sought after by corporate employer networks.
Phase 3: Integrate with the campus LMS
-
Tactical action: Connect the visual repository directly into your Learning Management System (like Canvas or Blackboard) and require live interactive links instead of file uploads.
-
Institutional outcome: Shortens grading cycles, eliminates manual file hand-offs, and unlocks full audit control over a document's revision history to guarantee student authenticity.

