Academic life is tough. You're not just writing a research paper; you're coordinating schedules, wrestling with version control, and trying to keep your data connected. Stop letting disorganization jeopardize your academic performance.
The secret to a successful thesis, dissertation, or group assignments in higher ed is moving beyond basic documents. It's time to embrace a visual research organization tool—specifically, Lucid's research project template.
This is your roadmap to success, designed to structure complex assignments, help your entire team align, and keep you on track with your deadlines.
Why students need a visual tool for academic research
Question: How do I manage a huge capstone project without getting overwhelmed?
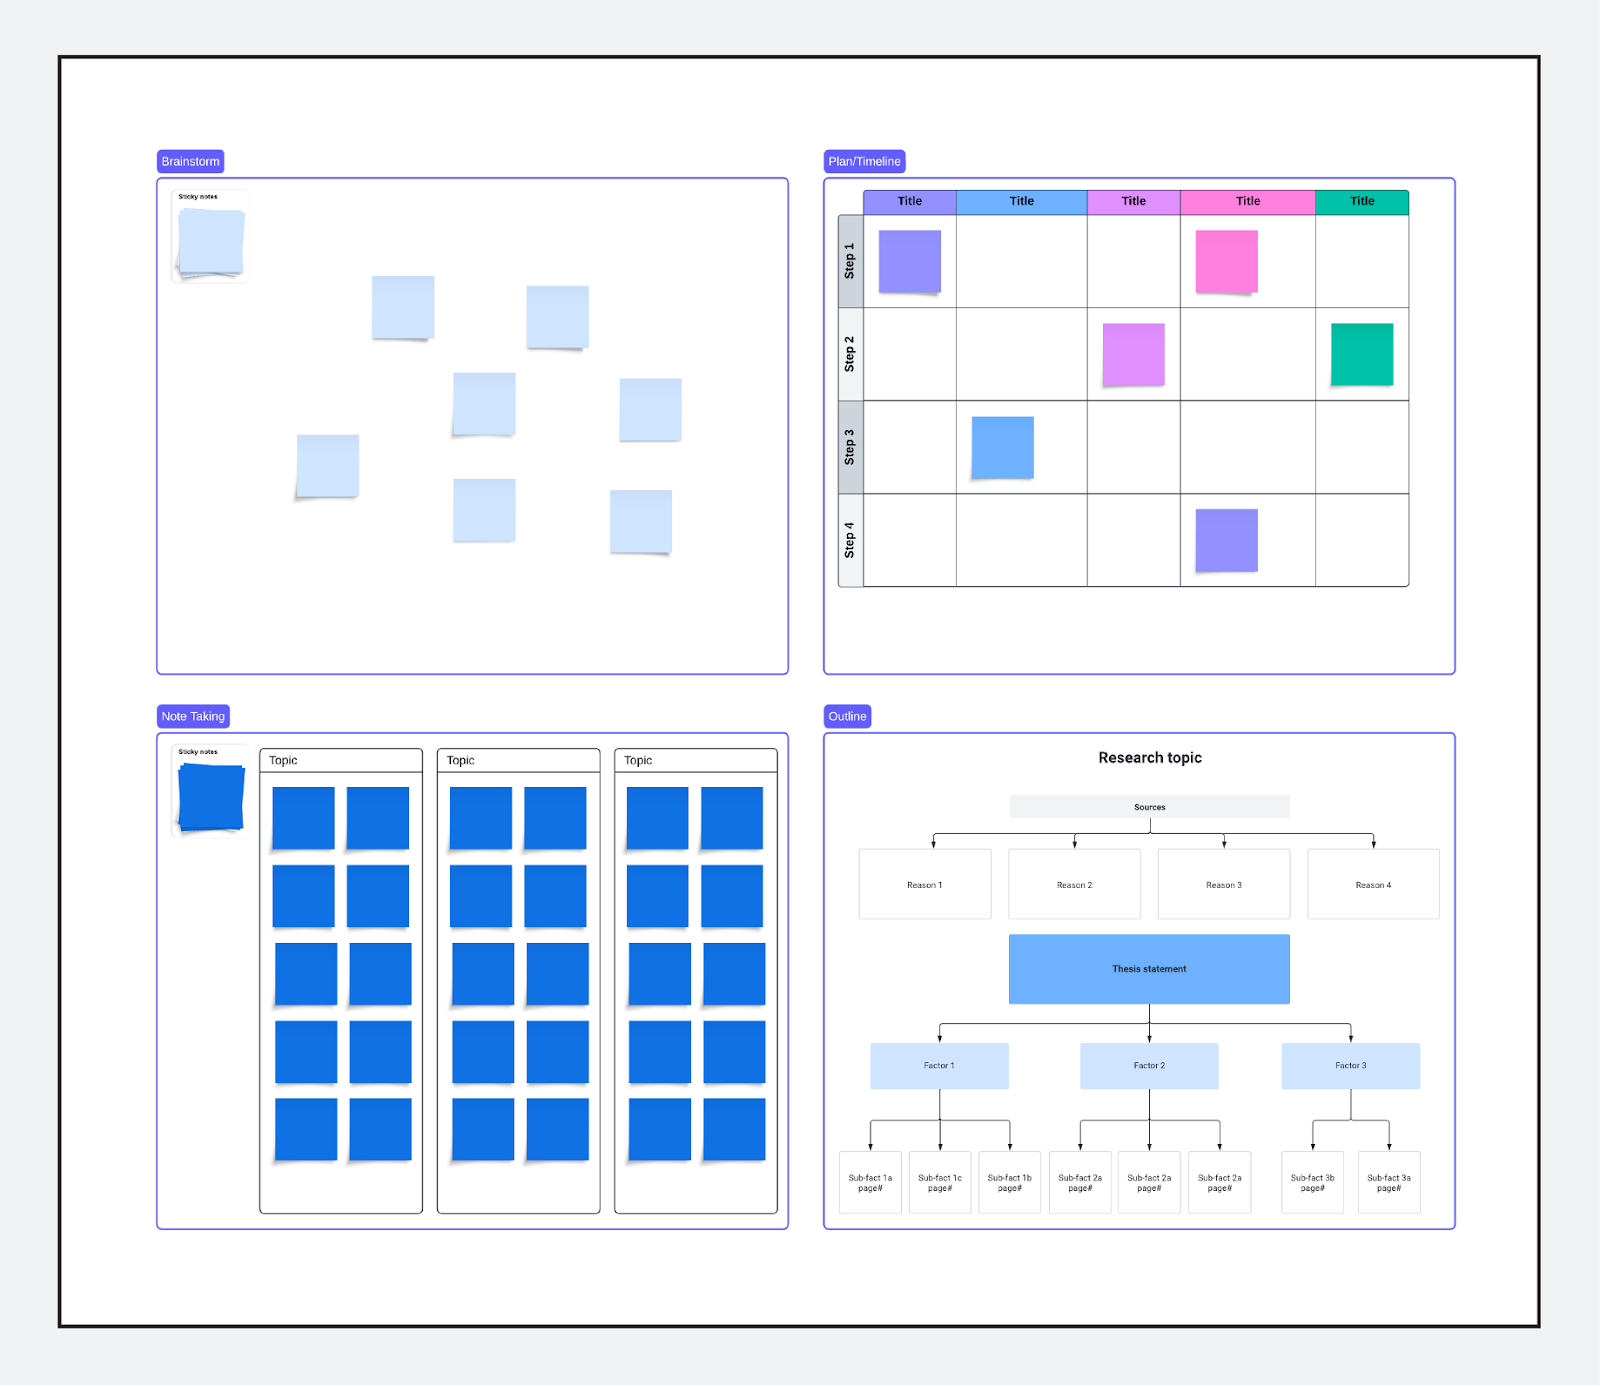
When the sheer scale of a project is the problem, organization is the answer. Text documents can create clutter; a visual platform creates clarity.
-
Eliminate version control nightmares: Lucid serves as the single source of truth for your project. Edits are real-time, meaning you can avoid the frustration of saving over outdated drafts.
-
Visualize your project timeline: Use the canvas as a Gantt chart or Kanban board to map out every phase: research, drafting, editing, and citation. Clearly assign tasks and deadlines to individual group members for instant accountability.
-
Connect concepts, not just text: Move beyond simple lists. Use Lucid to create concept maps that visually link your literature review sources to your core arguments. This can help you build a powerful, logically sound paper.
Optimize your research: From brainstorm to bibliography
Question: What is the best tool for organizing academic research and collaboration?
Effective academic research requires more than a word processor. Lucid templates are specifically built for the unique workflow of higher education.
1. Structural planning (the blueprint)
Before writing a single paragraph, outline your paper visually. This directly addresses the need for structure:
-
Thesis and hypotheses: Pinpoint the core argument and map the flow of evidence before you write.
-
Methodology flowcharts: For stem or social science students, use flowcharts to diagram the experimental setup, data collection process, or survey distribution. This makes your methods section clear, verifiable, and easy for faculty to review.
2. Collaborative efficiency (the easier group project)
-
Real-time editing: Group members can access and edit the project simultaneously, which can make collaborative work more efficient.
-
Feedback integration: Faculty and TAs can leave comments directly on the specific sections, diagrams, or outlines that need refinement.
Get the academic advantage: It's free for Higher Ed students!
Lucid templates and the entire suite of visual tools are available to help you streamline your education. Stop stressing over disorganization and start focusing on the quality of your research.