Supply and demand infographic

This supply and demand infographic template can help you:

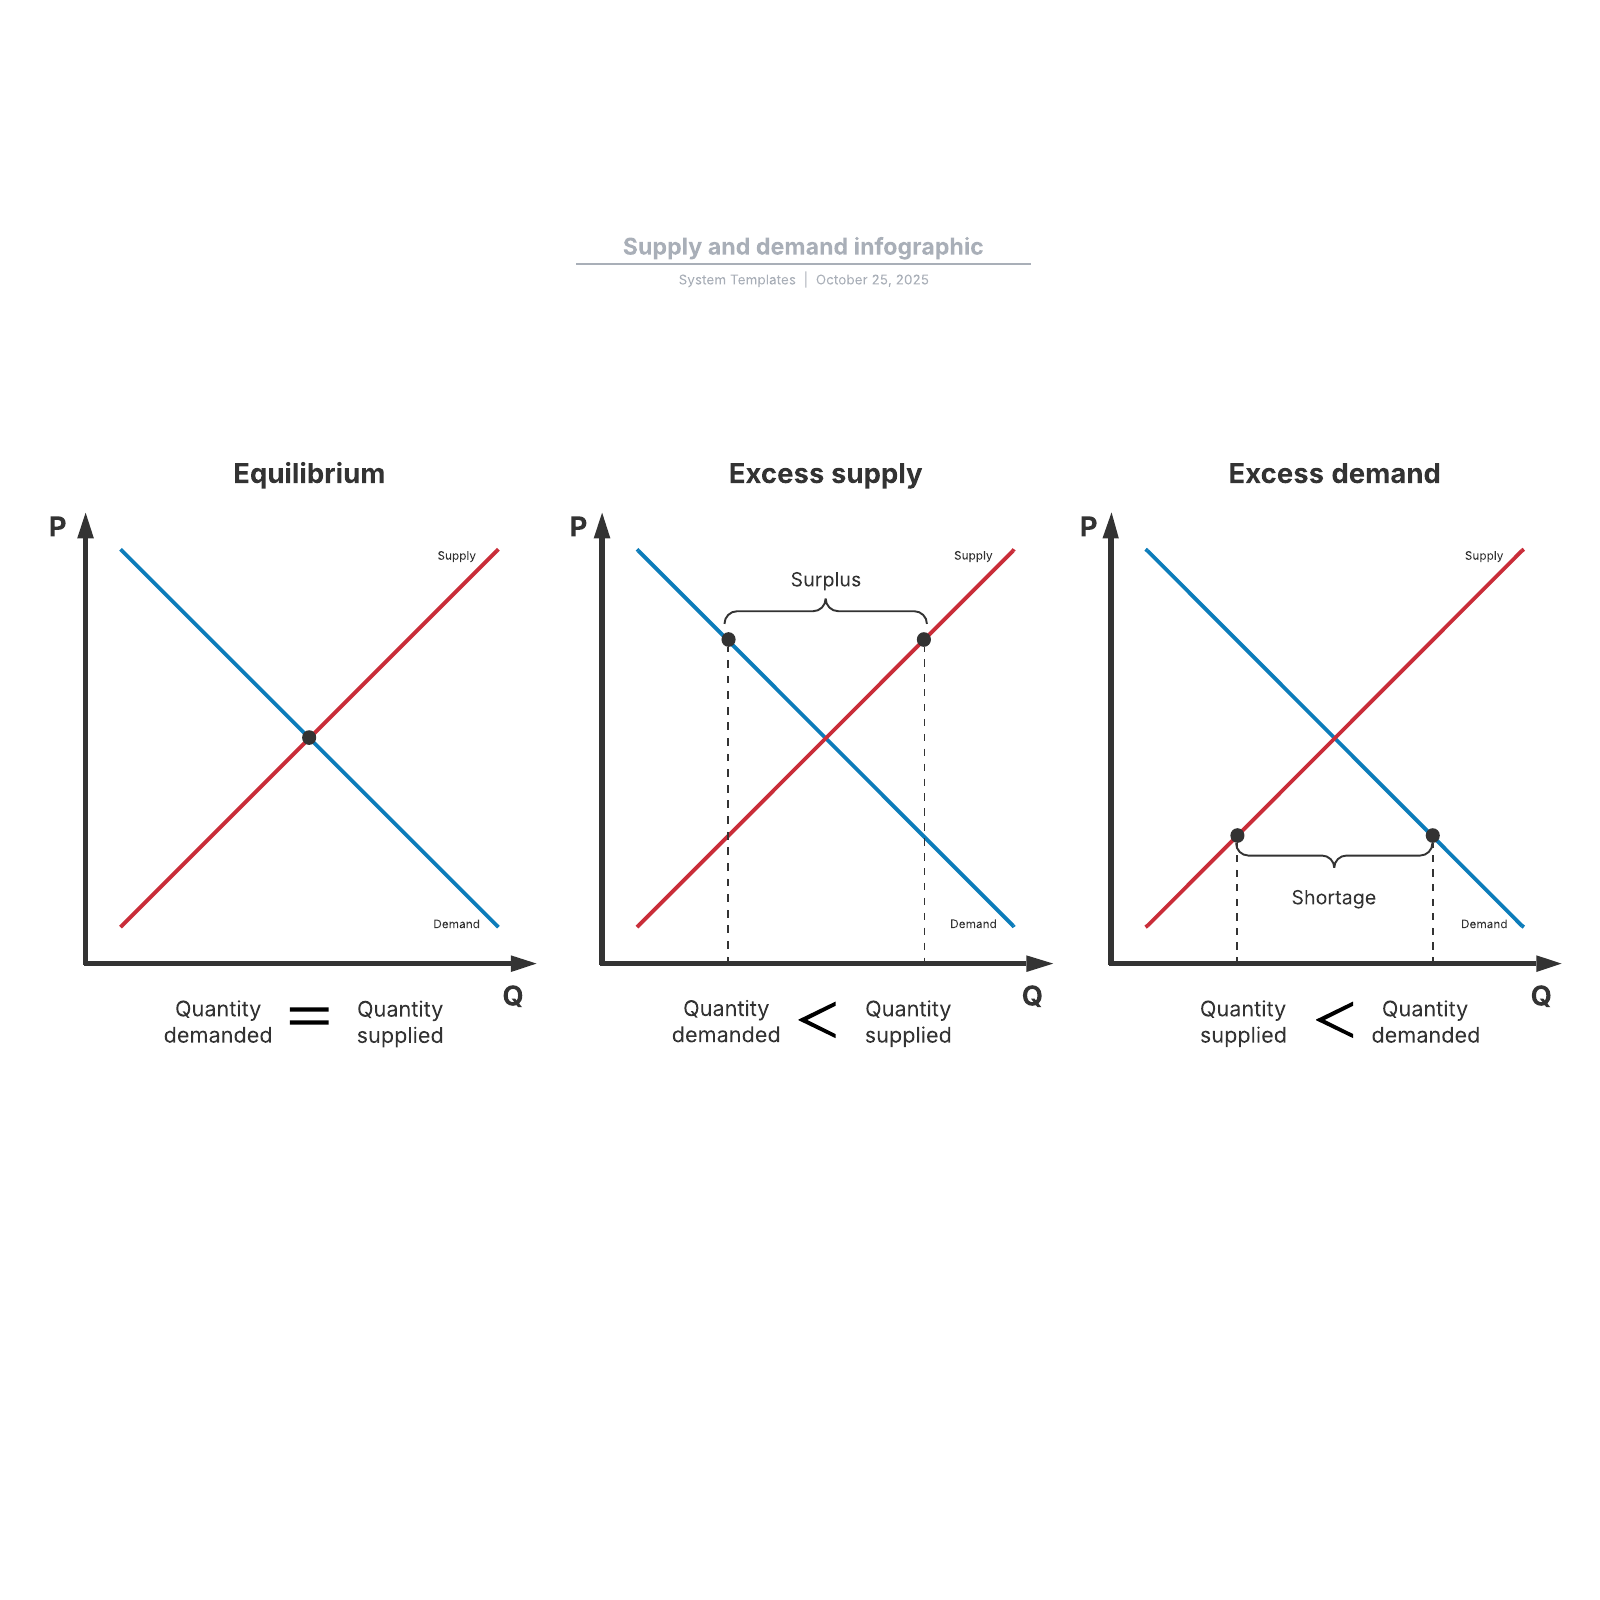
  • Show the relationship between supply and demand curves.
  • Visualize the difference between excess supply and excess demand.
  • Learn simple economics.

Open this template to view a detailed example of a supply and demand infographic that you can customize to your use case.

Use this template
Supply and demand infographic example

Related templates

Step-by-step chart

History timeline (Disneyland) example

Solutions

  • Lucid for Education
  • Lucidchart
  • Lucidspark
  • Lucid in Higher Education

Resources

  • Education Templates
  • Educator Resources
  • Video Center
  • Integrations
  • Lucidchart Help
PrivacyLegalCookie privacy choicesCookie policy
  • facebook
  • twitter
  • youtube
  • linkedin
  • pinterest
  • instagram
  • tiktok

© 2024 Lucid Software Inc.